. 2016 Nov 17:7:13479.
doi: 10.1038/ncomms13479.

The lipid sensor GPR120 promotes brown fat activation and FGF21 release from adipocytes

Affiliations

The lipid sensor GPR120 promotes brown fat activation and FGF21 release from adipocytes

Tania Quesada-López et al. Nat Commun. .

Abstract

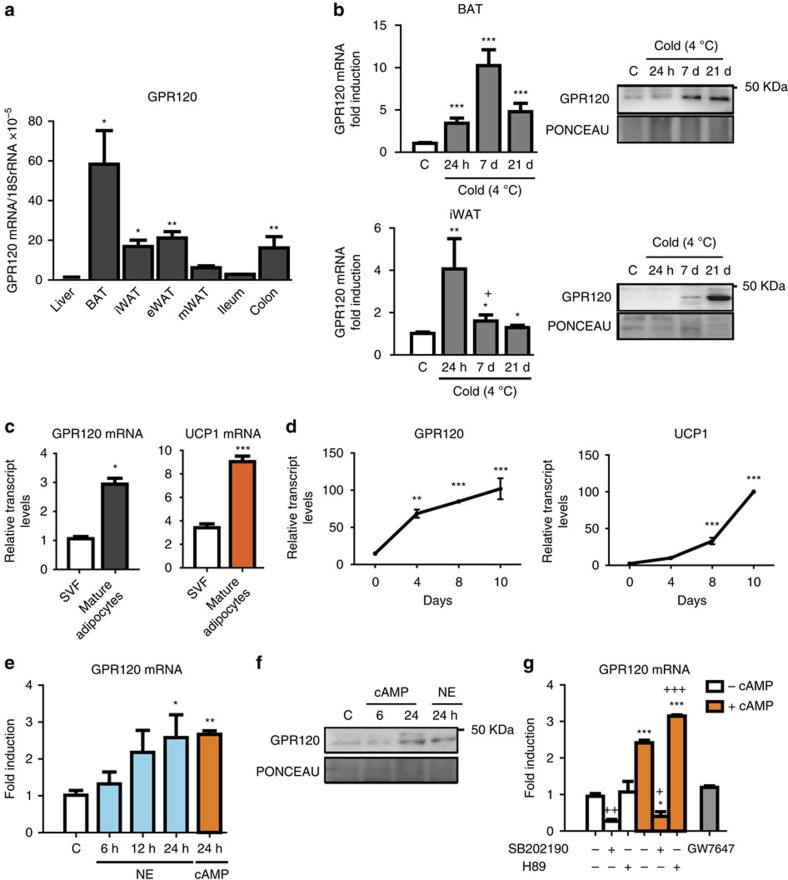
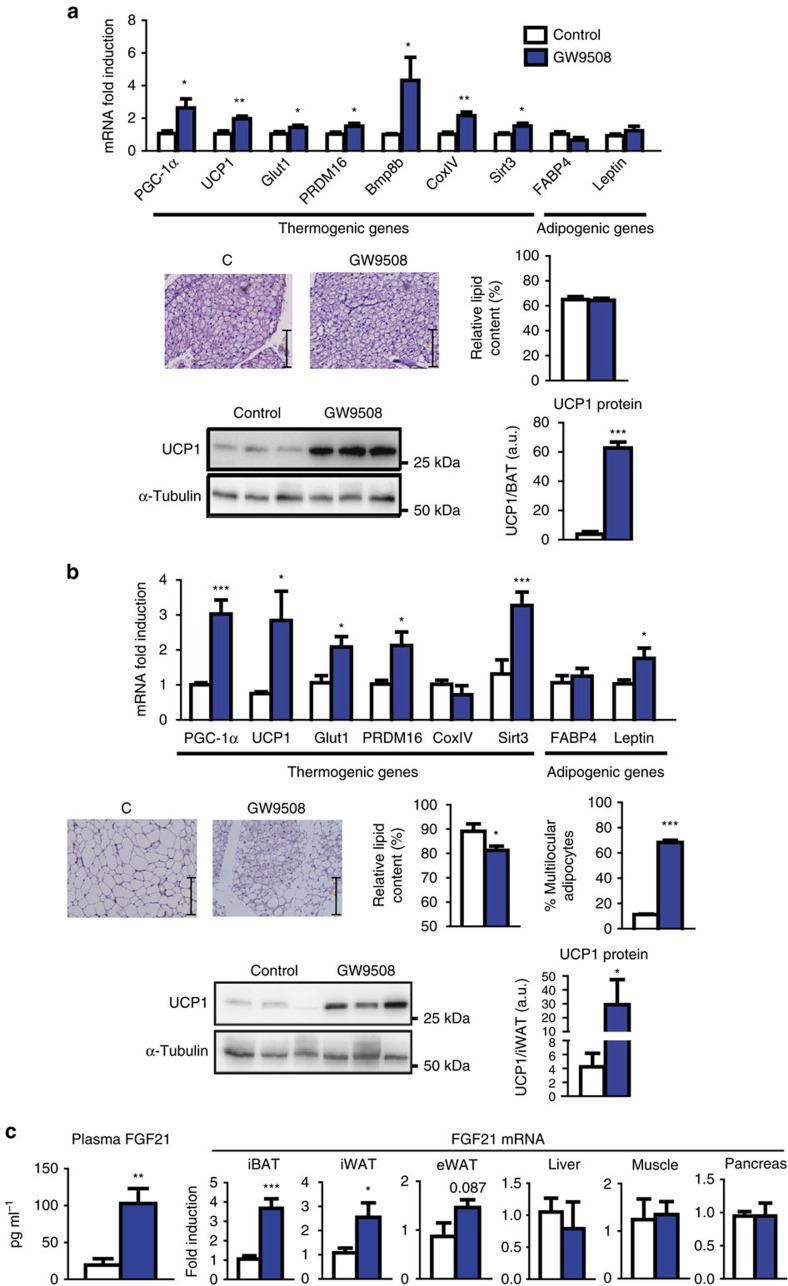
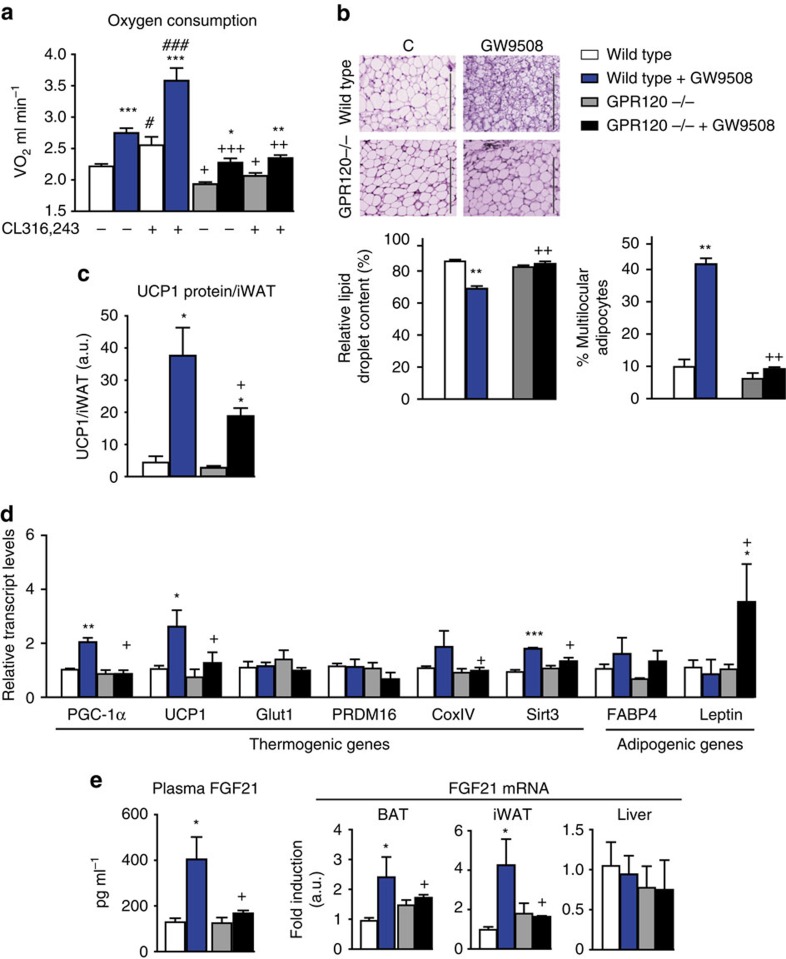
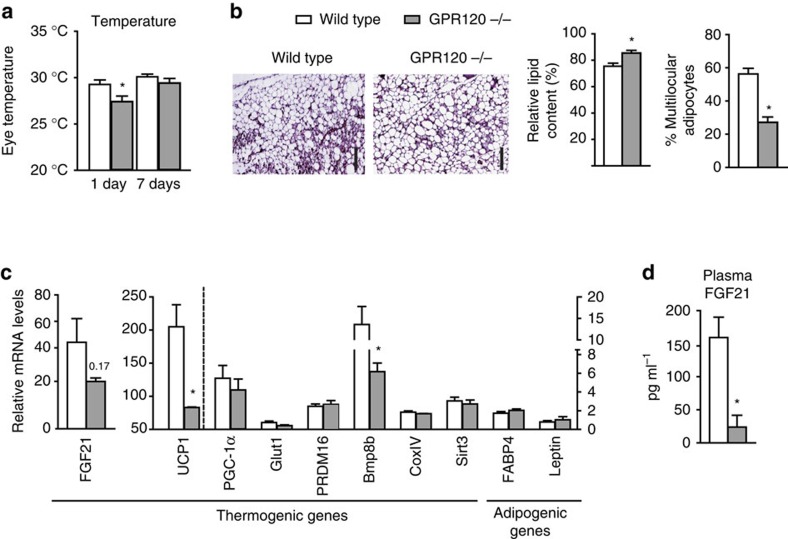
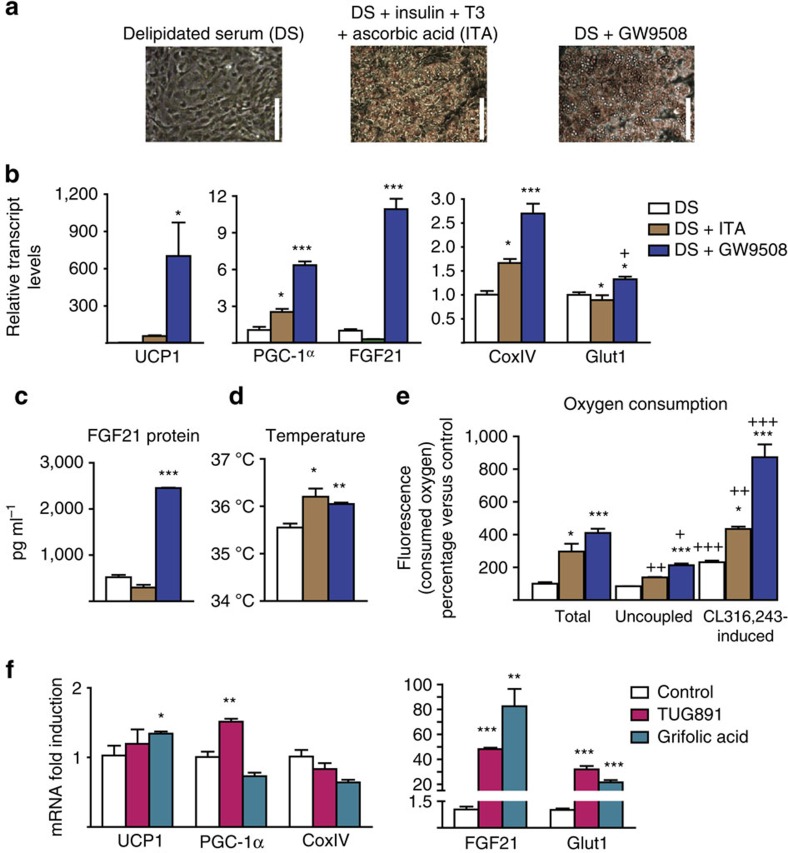
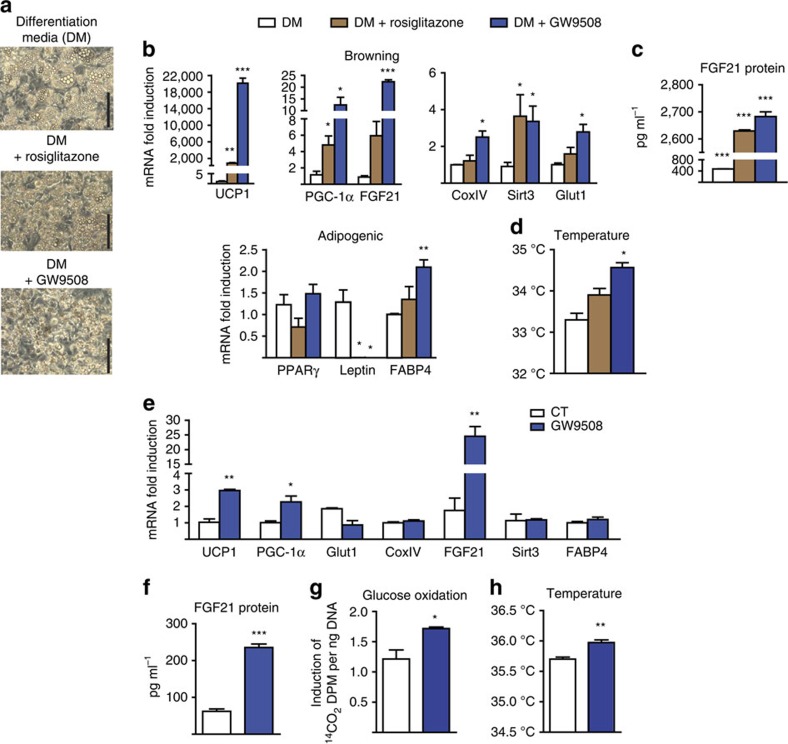
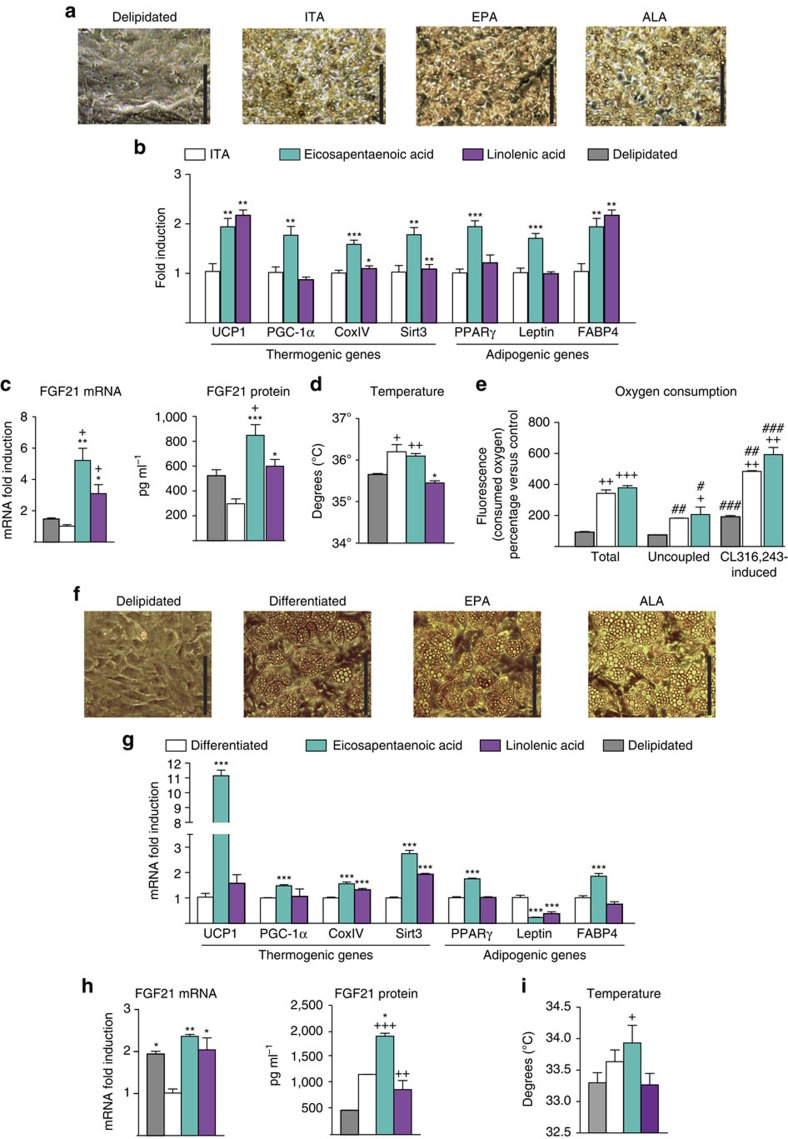
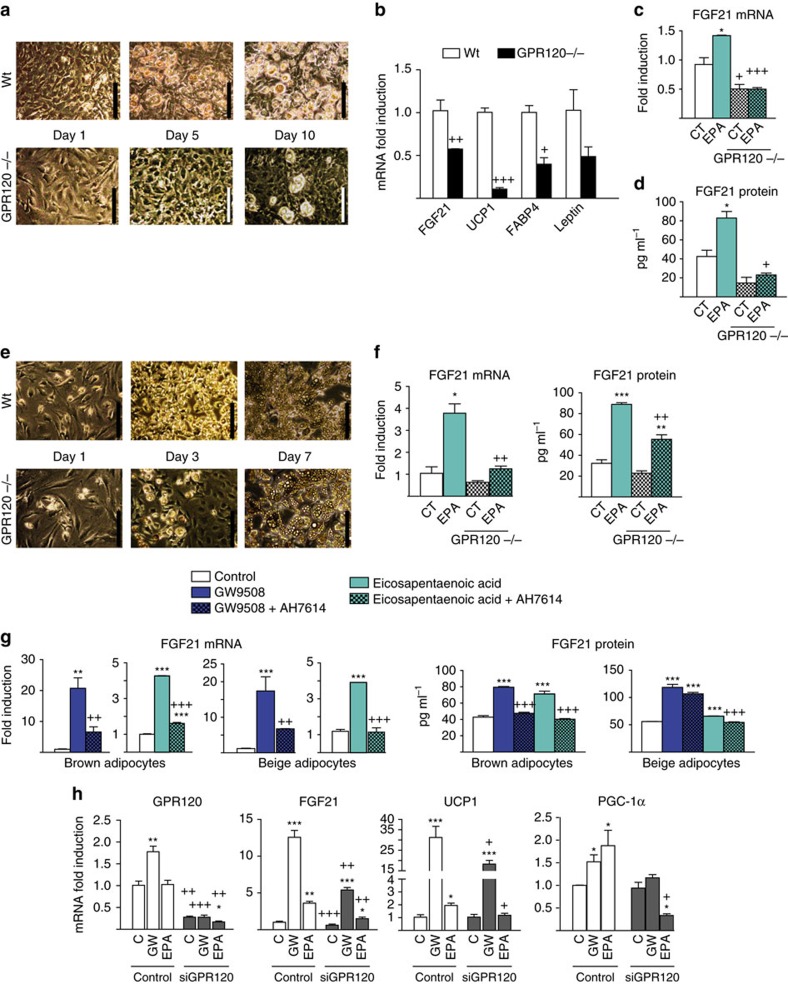
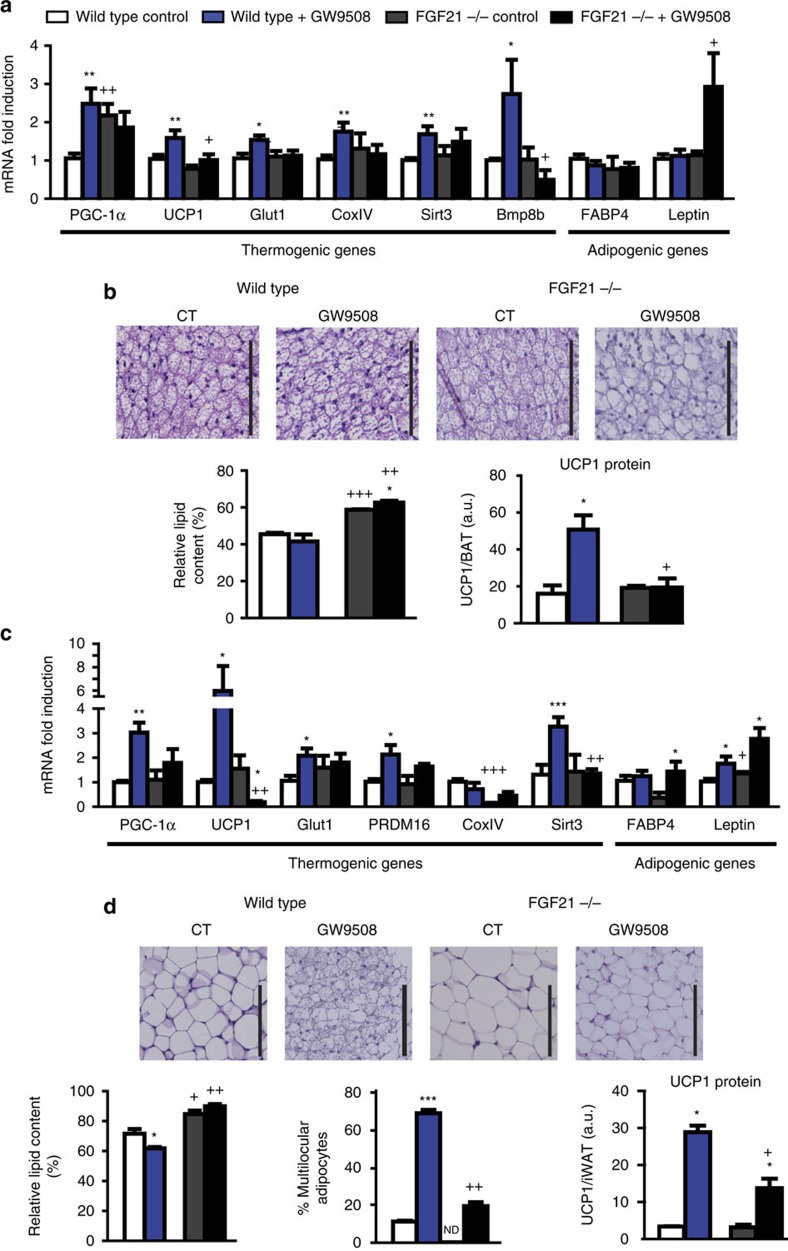
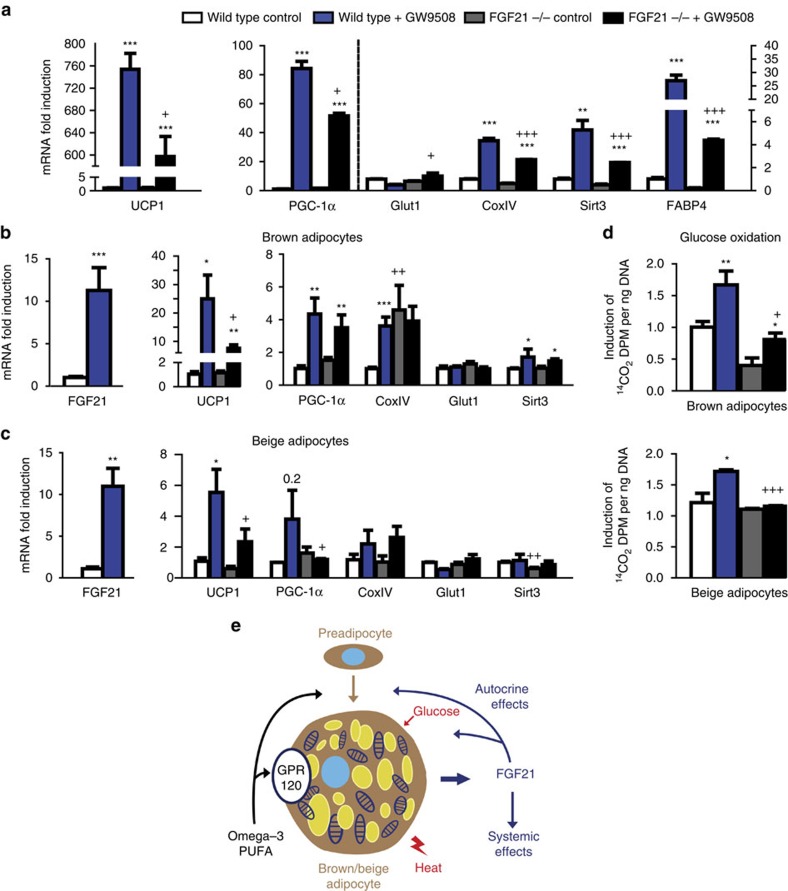
The thermogenic activity of brown adipose tissue (BAT) and browning of white adipose tissue are important components of energy expenditure. Here we show that GPR120, a receptor for polyunsaturated fatty acids, promotes brown fat activation. Using RNA-seq to analyse mouse BAT transcriptome, we find that the gene encoding GPR120 is induced by thermogenic activation. We further show that GPR120 activation induces BAT activity and promotes the browning of white fat in mice, whereas GRP120-null mice show impaired cold-induced browning. Omega-3 polyunsaturated fatty acids induce brown and beige adipocyte differentiation and thermogenic activation, and these effects require GPR120. GPR120 activation induces the release of fibroblast growth factor-21 (FGF21) by brown and beige adipocytes, and increases blood FGF21 levels. The effects of GPR120 activation on BAT activation and browning are impaired in FGF21-null mice and cells. Thus, the lipid sensor GPR120 activates brown fat via a mechanism that involves induction of FGF21.


Figures

Figure 1
Figure 1. Regulation of GPR120 gene expression in BAT and brown adipocytes.
For a, b, tissues from adult mice were analysed. (a) Relative expression of GPR120 mRNA in liver, BAT, iWAT, eWAT, mWAT, ileum and colon (n=4) was quantified. (b) GPR120 mRNA expression in BAT and iWAT from adult mice maintained at thermoneutrality (29 °C) or exposed to cold (4 °C) for 24 h, 7 days and 21 days (n=5) in the left, representative immunoblot of three independent assays of the relative changes of GPR120 protein, in the right. (c) mRNA levels of GPR120 and UCP1 in the stromal vascular fraction (SVF) and mature adipocytes obtained from iBAT (n=3). For d-g, BAT precursor cells were differentiated. (d) mRNA expression patterns for GPR120 and UCP1 during brown adipocyte differentiation in primary cultures, as assessed at days 0 (pre-adipocytes) 4, 8, and 10 (n=3). (e) GPR120 mRNA levels in differentiated brown adipocytes treated with 0.5 μM norepinephrine (NE) for 6, 12 and 24 h (blue bars) or with 1 mM dibutyryl-cAMP for 24 h (orange bars; n=4). (f) Representative immunoblot of three independent assays of the relative changes of GPR120 protein levels in response to the indicated NE and cAMP treatments. (g) Effects of 10 μM SB202190 (a p38 MAPK inhibitor), or 20 μM H89 (a PKA inhibitor) on the upregulation of GPR120 mRNA in response to 1 mM dibutyryl-cAMP (orange bars), and effects of 1 μM GW7647 (PPARα agonist, grey bar; n=4). Bars are means+s.e.m. (*P<0.05, **P<0.01 and ***P<0.001 compared with corresponding controls, or ileum; +P<0.05, ++P<0.01, +++P<0.001 for the effects of SB202190 or H89; for a, b, e and g analysis of variance with Tukey's post hoc test was used; for c and d two-tailed unpaired Student's t-test was performed).
Figure 2
Figure 2. GW9508 upregulates thermogenic genes in iBAT and browning in iWAT while inducing FGF21 expression and release.
Adult mice were fed for 7 days a control diet (white bars) or a diet supplemented with GW9508 (blue bars; n=6). (a) Relative expression levels of thermogenic and adipogenic genes in iBAT, representative optical microscopy images from H&E-stained iBAT (scale bar, 125 μm), relative lipid content, UCP1 protein levels and representative UCP1 immunoblot. (b) Relative expression levels of thermogenic and adipogenic genes in iWAT, representative optical microscopy from H&E-stained iWAT (scale bar, 125 μm), relative lipid content, percentage of multilocular adipocytes, UCP1 protein levels and representative UCP1 immunoblot. (c) Circulating levels of FGF21 protein and FGF21 mRNA expression levels in iBAT, iWAT, eWAT, liver, skeletal muscle and pancreas. Bars are means+s.e.m. (*P<0.05, **P<0.01 and ***P<0.001 relative to untreated control mice; two-tailed unpaired Student's t-test).
Figure 3
Figure 3. GPR120 gene invalidation blunts the effects of GW9508 on adipose tissues and systemic FGF21 levels.
Wild-type and GPR120−/− mice were fed a control diet (white and grey bars, respectively) or a diet supplemented with GW9508 (blue and black bars, respectively) for 7 days (n=5 per group). (a) Oxygen consumption in basal conditions and after CL316,243 injection. (b) Representative optical microscopy from H&E-stained iWAT (scale bar, 200 μm), relative lipid content and percentage of multilocular adipocytes. (c) UCP1 protein levels in iWAT. (d) Relative expression levels of thermogenic and adipogenic genes in iWAT. (e) Circulating levels of FGF21 protein and FGF21 mRNA expression levels in iBAT, iWAT and liver. Bars are means+s.e.m. (*P<0.05, **P<0.01 and ***P<0.001 relative to untreated control mice of each genotype; +P<0.05, ++P<0.01 and +++P<0.001 for the comparisons between genotypes under same GW9508 treatment status; #P<0.05, ###P<0.001 for the effects of GW9508 treatment; analysis of variance with Tukey's post hoc test).
Figure 4
Figure 4. GPR120 gene invalidation compromises thermoregulation and iWAT browning in association with a reduction in FGF21 levels.
Wild-type (Wt, white bars) mice and GPR120−/− mice (grey bars) mice were exposed to cold (4 °C) for 7 days (n=5). (a) Body temperature on days 1 and 7 of cold exposure. (b) Representative images of H&E-stained iWAT (scale bar, 200 μm), the relative lipid droplet content, and the percentage of multilocular adipocytes. (c) Relative expression levels of thermogenic and adipogenic genes in iWAT. (d) Circulating levels of FGF21. Bars are means+s.e.m. (*P<0.05, **P<0.01 and ***P<0.001 relative to wild-type animals exposed to cold; two-tailed unpaired Student's t-test).
Figure 5
Figure 5. GPR120 activation induces brown adipocyte differentiation and increases FGF21 expression and release.
For ae, iBAT precursors were differentiated in the presence of standard culture medium supplemented as follows: with 10% delipidated serum (DS, white bars; n=4); with DS plus insulin, triiodothyronine and ascorbic acid (DS+ITA, brown bars; n=5); or with DS plus 100 μM GW9508 (blue bars; n=4). (a) Representative optical microscopy images from cells at the end of the differentiation (day 9) (scale bars, 200 μm). (b) Relative mRNA expression levels of UCP1, PGC-1α, COXIV, FGF21 and Glut1. (c) FGF21 protein levels in cell culture media (4 day accumulation). (d) Cell culture temperature. (e) Total and uncoupled (oligomycin-resistant) respiration, and respiration after CL316,243 treatment (f) iBAT precursors from mice were differentiated with DS+ITA, mRNA expression levels of UCP1, PGC-1α, CoxIV, FGF21 and Glut1 after 24 h treatment with TUG-891 (200 μM, pink bars) or grifolic acid (100 μM, turquoise bars). Bars are means+s.e.m. (P values: *P<0.05, **P<0.01 and ***P<0.001 versus DS (be) or versus controls (f); +P<0.05, ++P<0.01 and +++P<0.001 for uncoupled respiration or induction in respiration upon CL316,243 versus total respiration; analysis of variance with Tukey's post hoc test).
Figure 6
Figure 6. GPR120 activation promotes beige adipocyte differentiation and increases FGF21 expression and release.
For ad, iWAT precursors from mice were differentiated in the presence of the differentiation media (DM, white bars), supplemented with rosiglitazone to drive beige differentiation (DM+rosiglitazone, brown bars; n=4) or treated with GW9508 instead of rosiglitazone (DM+GW9508, blue bars; n=5; see the Methods section). (a) Representative optical microscopy images at the end of differentiation (day 7; scale bar, 200 μm). (b) Relative mRNA expression levels of browning-related and general adipogenic genes. (c) FGF21 protein levels in the cell culture medium (4 day accumulation). (d) Cell culture temperature. For eh, iWAT precursors were differentiated and treated during 24 h with GW9508 (100 μM, blue bars; n=5) or nor treated (n=3). (e) mRNA expression levels of UCP1, PGC-1α, Glut1, COXIV, FGF21, Sirt3 and FABP4. (f) FGF21 protein levels in culture media (24 h accumulation). (g) Glucose oxidation rate. (h) Cell culture temperature. Bars are means+s.e.m. (*P<0.05, **P<0.01 and ***P<0.001 versus DM (bd) or versus controls (eh); for bd, analysis of variance with Tukey's post hoc test was performed; for eh, two-tailed unpaired Student's t-test).
Figure 7
Figure 7. n-3 PUFAs upregulate thermogenic genes expression and FGF21 expression and release.
For ad, iBAT precursors were cultured in media containing only delipidated serum (grey bars), or in the presence of insulin, T3 and ascorbic acid (ITA, white bars) or supplemented with eicosapentaenoic acid (EPA, tourquoise bars) or linolenic acid (ALA, purple bars). (a) Representative optical microscopy images of cultured brown precursors after the treatment (scale bar, 200 μm). (b) Relative mRNA expression of thermogenesis-related and general adipogenesis-related genes. (c) FGF21 mRNA in adipocytes and protein levels in culture media. (d) Cell culture temperature. (e) Total and uncoupled respiration after differentiation and after treatment with CL316,243. For fi, iWAT precursors were cultured in media containing only delipidated serum (grey bars), adipogenic cocktail (see the Methods section, white bars), or supplemented with EPA (turquoise bars) or ALA (purple bars). (f) Representative optical microscopy images of cultured beige precursors after the treatment (scale bar, 200 μm). (g) Relative mRNA expression of thermogenesis-related and general adipogenesis-related genes. (h) FGF21 mRNA in adipocytes, protein levels in culture media and (i) cell temperature at the end of the treatment. Bars are means+s.e.m.(*P<0.05, **P<0.01 and ***P<0.001 versus differentiated ITA, +P<0.05, ++P<0.01 and +++P<0.001 versus delipidated, #P<0.05, ##P<0.01 and ###P<0.001 relative to total respiration; analysis of variance with Tukey's post hoc test).
Figure 8
Figure 8. GPR120 is required for the effects of EPA on adipocytes and FGF21 induction and release.
For ad, iBAT precursors from wild-type (n=3, white) and GPR120-null (n=5, black) mice were differentiated. (a) Representative optical microscopy images (scale bar, 200 μm). (b) Relative mRNA expression levels of FGF21, UCP1, FABP4 and leptin. (c,d) Effects of EPA on FGF21 mRNA expression and FGF21 secretion. For e and f, iWAT precursors from wild-type (n=3) and GPR120-null (n=5) mice were differentiated into beige adipocytes. (e) Representative optical microscopic images (scale bar, 200 μm). (f) Effects of EPA on FGF21 mRNA expression and FGF21 protein secretion. (g) Differentiated brown and beige adipocytes were treated with GW9508 (blue bars) or EPA (turquoise bars) in the presence or absence of AH7614 (a GPR120 antagonist, patterned bars) for 24 h (n=3). FGF21 mRNA expression and FGF21 protein levels in culture medium. (h) Differentiated brown adipocytes were subjected to siRNA-mediated knockdown of GPR120 (see the Methods section) and treated with GW9508 or EPA. mRNA expression levels of GPR120, FGF21, PGC-1α and UCP1 (n=3). Bars are means+s.e.m. (*P<0.05, **P<0.01 and ***P<0.001 relative to controls, and +P<0.05, ++P<0.01 and +++P<0.001 for comparisons between wild-type and GPR120-null cells (af), the effects due to AH7614 (g), and the effects due to siRNA-GPR120 (h). For b, two-tailed unpaired Student's t-test was performed; for ch, analysis of variance with Tukey's post hoc test).
Figure 9
Figure 9. FGF21 gene invalidation reduces the effects of GW9508 treatment in mice.
Wild-type and FGF21-null mice were fed a control diet (white and grey bars, respectively) or supplemented with GW9508 (blue and black bars, respectively) for 7 days (n=5). (a) Relative mRNA levels of thermogenesis-related and adipogenic genes in iBAT (c) and iWAT. Representative optical microscopy images of H&E staining (scale bar, 125 μm), the relative lipid content and UCP1 protein levels in iBAT (b) and iWAT (d), and the percentage of multilocular adipocytes in iWAT. Bars are means+s.e.m. (*P<0.05, **P<0.01 and ***P<0.001 relative to untreated control mice of each genotype; +P<0.05, ++P<0.01 and +++P<0.001 relative to same treatment of the wild-type group; analysis of variance with Tukey's post hoc test).
Figure 10
Figure 10. Impaired effects of GW9508 on FGF21-null brown and beige adipocytes.
(a) iBAT precursors from wild-type and FGF21-null mice (n=5) were treated with GW9508 during differentiation, relative transcript levels of UCP1, PGC-1α, Glut1, CoxIV, Sirt3 and FABP4. (b) iBAT precursors from wild-type and FGF21-null mice (n=5) were differentiated and acutely treated with GW9508 (24 h), mRNA expression levels of FGF21, UCP1, PGC-1α, CoxIV, Glut1 and Sirt3. (c) iWAT precursors from wild-type and FGF21-null mice (n=5) were differentiated and acutely treated with GW9508 (24 h), mRNA expression levels of FGF21, UCP1, PGC-1α, CoxIV, Glut1 and Sirt3. (d) Glucose oxidation in iBAT and iWAT-derived adipocytes from wild-type and FGF21-null mice after 24 h treatment with GW9508. Bars are means+s.e.m. (*P<0.05, **P<0.01 and ***P<0.001 for the effects of GW9508; and +P<0.05, ++P<0.01 +++P<0.001 for comparisons between wild-type and FGF21-null cells; and analysis of variance with Tukey's post hoc test). (e) Schematic representation of the effects of GPR120 activation by n-3 PUFAs on brown and beige adipocytes. FGF21 is involved in the GPR120 activation-mediated thermogenic activation of BAT and WAT via autocrine/endocrine mechanisms.

Similar articles

Cited by

References

    1. Lowell B. B. et al.. Development of obesity in transgenic mice after genetic ablation of brown adipose tissue. Nature 366, 740–742 (1993). - PubMed
    1. Feldmann H. M., Golozoubova V., Cannon B. & Nedergaard J. UCP1 ablation induces obesity and abolishes diet-induced thermogenesis in mice exempt from thermal stress by living at thermoneutrality. Cell Metab. 9, 203–209 (2009). - PubMed
    1. Betz M. J. & Enerbäck S. Human brown adipose tissue: what we have learned so far. Diabetes 64, 2352–2412 (2015). - PubMed
    1. Giralt M. & Villarroya F. White, brown, beige/brite: different adipose cells for different functions? Endocrinology 154, 2992–3000 (2013). - PubMed
    1. Shabalina I. G. et al.. UCP1 in brite/beige adipose tissue mitochondria is functionally thermogenic. Cell. Rep. 5, 1196–1399 (2013). - PubMed

Publication types

MeSH terms