

Abrupt Holocene climate change as an important factor for human migration in West Greenland
- PMID: 21628586
- PMCID: PMC3116382
- DOI: 10.1073/pnas.1101708108
Abrupt Holocene climate change as an important factor for human migration in West Greenland
Abstract
West Greenland has had multiple episodes of human colonization and cultural transitions over the past 4,500 y. However, the explanations for these large-scale human migrations are varied, including climatic factors, resistance to adaptation, economic marginalization, mercantile exploration, and hostile neighborhood interactions. Evaluating the potential role of climate change is complicated by the lack of quantitative paleoclimate reconstructions near settlement areas and by the relative stability of Holocene temperature derived from ice cores atop the Greenland ice sheet. Here we present high-resolution records of temperature over the past 5,600 y based on alkenone unsaturation in sediments of two lakes in West Greenland. We find that major temperature changes in the past 4,500 y occurred abruptly (within decades), and were coeval in timing with the archaeological records of settlement and abandonment of the Saqqaq, Dorset, and Norse cultures, which suggests that abrupt temperature changes profoundly impacted human civilization in the region. Temperature variations in West Greenland display an antiphased relationship to temperature changes in Ireland over centennial to millennial timescales, resembling the interannual to multidecadal temperature seesaw associated with the North Atlantic Oscillation.
Conflict of interest statement
The authors declare no conflict of interest.
Figures

 from Braya Sø water filters collected during summer 2007 (red diamonds) and 2009 (blue squares) and a previously published calibration (12) from Europe (black circles).
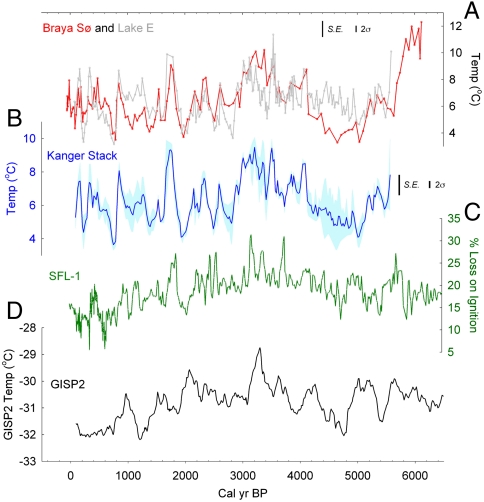

Similar articles
-
Rapid coupling between ice volume and polar temperature over the past 150,000 years.Nature. 2012 Nov 29;491(7426):744-7. doi: 10.1038/nature11593. Epub 2012 Nov 14. Nature. 2012. PMID: 23151478
-
North Atlantic forcing of tropical Indian Ocean climate.Nature. 2014 May 1;509(7498):76-80. doi: 10.1038/nature13196. Nature. 2014. PMID: 24784218
-
Glacial greenhouse-gas fluctuations controlled by ocean circulation changes.Nature. 2008 Nov 20;456(7220):373-6. doi: 10.1038/nature07531. Nature. 2008. PMID: 19020618
-
Abrupt Change in Climate and Biotic Systems.Curr Biol. 2019 Oct 7;29(19):R1045-R1054. doi: 10.1016/j.cub.2019.08.066. Curr Biol. 2019. PMID: 31593663 Review.
-
The Atlantic Meridional Overturning Circulation and Abrupt Climate Change.Ann Rev Mar Sci. 2017 Jan 3;9:83-104. doi: 10.1146/annurev-marine-010816-060415. Epub 2016 Oct 28. Ann Rev Mar Sci. 2017. PMID: 27814029 Review.
Cited by
-
Migration and sustainable development.Proc Natl Acad Sci U S A. 2024 Jan 16;121(3):e2206193121. doi: 10.1073/pnas.2206193121. Epub 2024 Jan 8. Proc Natl Acad Sci U S A. 2024. PMID: 38190541 Free PMC article.
-
Paradoxical cold conditions during the medieval climate anomaly in the Western Arctic.Sci Rep. 2016 Sep 9;6:32984. doi: 10.1038/srep32984. Sci Rep. 2016. PMID: 27609585 Free PMC article.
-
Prolonged drying trend coincident with the demise of Norse settlement in southern Greenland.Sci Adv. 2022 Mar 25;8(12):eabm4346. doi: 10.1126/sciadv.abm4346. Epub 2022 Mar 23. Sci Adv. 2022. PMID: 35319972 Free PMC article.
-
Comparative molecular microbial ecology of the spring haptophyte bloom in a greenland arctic oligosaline lake.Front Microbiol. 2012 Dec 17;3:415. doi: 10.3389/fmicb.2012.00415. eCollection 2012. Front Microbiol. 2012. PMID: 23251134 Free PMC article.
-
Climate change-induced migration: a bibliometric review.Global Health. 2021 Jul 3;17(1):74. doi: 10.1186/s12992-021-00722-3. Global Health. 2021. PMID: 34217341 Free PMC article. Review.
References
-
- Jensen JF. Palaeo-eskimo continuity and discontinuity in west Greenland. In: Sutherland PD, editor. Contributions to the Study of the Dorset Palaeo-Eskimos. Vol. 167. Gatineau, QC: Canadian Museum of Civilization; 2005. pp. 93–103. Mercury Series, Archaeology Paper.
-
- McGhee R. Ancient People of the Arctic. Vancouver, BC: Univ of British Columbia Press; 1996.
-
- Jensen JF. The Stone Age of Qeqertarsuup Tunua (Disko Bugt): A regional analysis of the Saqqaq and Dorset cultures of Central West Greenland. Meddelelser om Grønland, Man & Society. 2006;32:1–245.
-
- Gotfredsen AB, Mobjerg T. Nipisat—a Saqqaq culture site in Sisimiut, Central West Greenland. Meddelelser om Grønland, Man & Society. 2004;31:1–272.
-
- Møbjerg T. New adaptive strategies in the Saqqaq culture of Greenland, c. 1600–1400 BC. World Archaeol. 1999;30:452–465.
Publication types
MeSH terms
Substances
LinkOut - more resources
Full Text Sources
Medical
Miscellaneous
